Meteorological Data

Air Toxics Intro | Air Toxics and Health | Air Toxics for Business | Air Toxics Regulations


AERMOD-ready meteorological data sets and AERSURFACE output files for use in AERSCREEN are available for dispersion modeling in Santa Barbara County.  Please download the data you need from the table below.  These input files were pre-processed using the AERMET program.

 Met Data Set NameLatitudeLongitudeElevation (m)AERMOD-Ready Met Data Sets AERSURFACE Output FilesWind Roses
Carpinteria34.403-119.458137Carp19-23.zipCarp19-23aersurface.zipCarp 2019-2023 Wind Rose (opens in a new tab)
Ellwood34.431-119.9125Ellwood19-23.zipEllwood19-23aersurface.zipEllwood 2019-2023 Wind Rose (opens in a new tab)
Goleta34.446-119.82814Goleta19-23.zipGoleta19-23aersurface.zipGoleta 2019-2023 Wind Rose (opens in a new tab)
Las Flores Canyon34.490-120.047184LFC19-23.zipLFC19-23aersurface.zipLFC 2019-2023 Wind Rose (opens in a new tab)
Lompoc H Street34.638-120.45841LompocHSt19-23.zipLompocHSt19-23aersurface.zipLompoc H St 2019-2023 Wind Rose (opens in a new tab)
Paradise Road34.542-119.791371Paradise19-23.zipParadise19-236aersurface.zipParadise 2019-2023 Wind Rose (opens in a new tab)
SB National Guard34.428-119.69120SBNG19-23.zipSBNG19-23aersurface.zipSBNG 2019-2023 Wind Rose (opens in a new tab)
Santa Barbara Airport*34.424-119.8424SBA19-23Ustar.zipSBA19-236aersurface.zipSBA U* 2019-2023 Wind Rose (opens in a new tab)
Santa Maria Airport*34.894-120.45280SMX19-23Ustar.zipSMX19-23aersurface.zipSMX U* 2019-2023 Wind Rose (opens in a new tab)
Santa Ynez Airport*34.606-120.075210SQA19-23Ustar.zipSQA19-23aersurface.zipSQA U* 2019-2023 Wind Rose (opens in a new tab)
Vandenberg Airport*34.717-120.567112VBG19-23Ustar.zipVBG19-23aersurface.zipVBG U* 2019-2023 Wind Rose (opens in a new tab)

* The Santa Barbara Airport, Santa Maria Airport, Santa Ynez Airport and Vandenberg Airport meteorological data sets were processed using the U star adjustment option (ADJ_U*).  The ADJ_U* option was used for these data sets because they do not include turbulence, or sigma-theta, measurements.  AERMOD automatically detects that the meteorological data was processed using the ADJ_U* option.

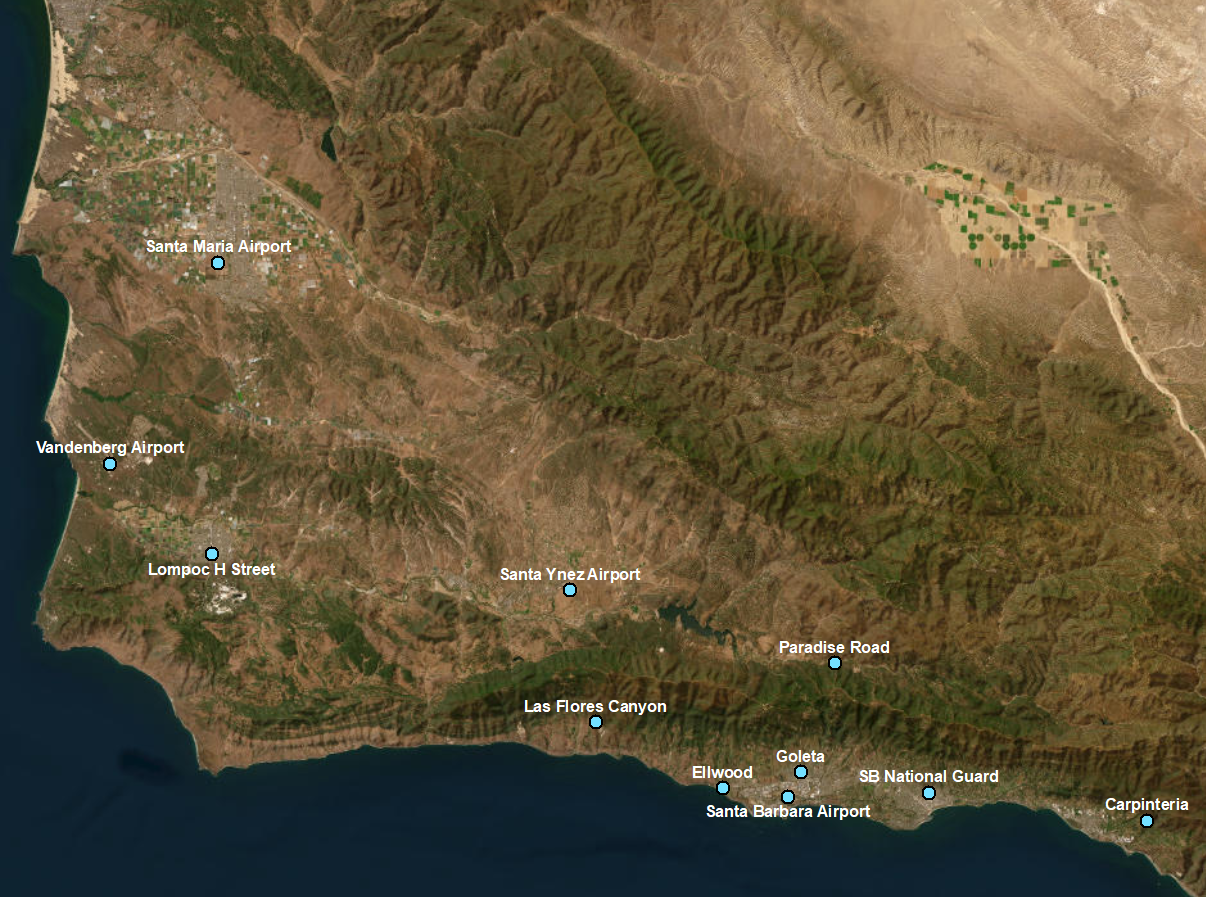
The locations of the meteorological stations where the data were gathered are shown in the image below.

The AERMOD modeling system can be obtained from the USEPA’s website (opens in a new tab).

The HARP modeling program can be obtained from the ARB’s website (opens in a new tab).

For more information or assistance, please contact [email protected].