The Santa Barbara monitor is currently offline. We apologize for the inconvenience. In the meantime, please refer to the readings from the other monitoring stations.
Current Air Quality Conditions
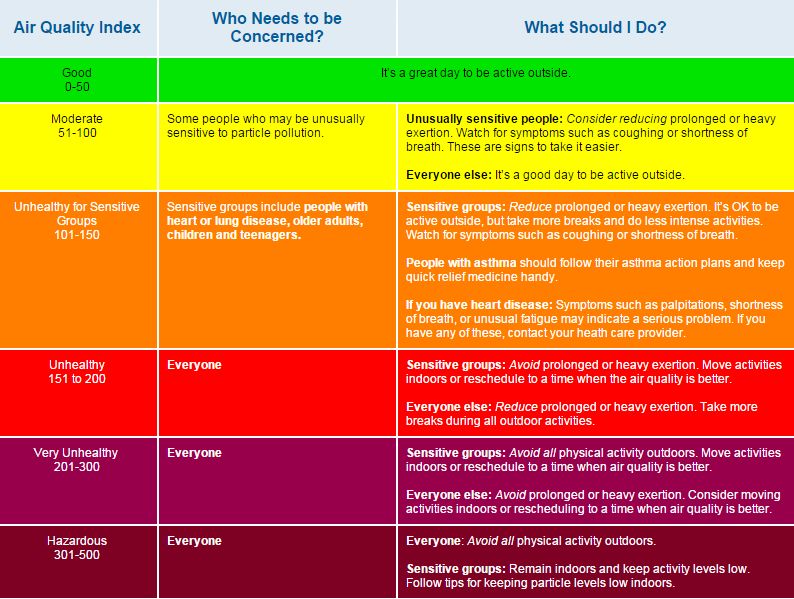
Air quality values and colors shown here correspond with the Air Quality Index (AQI). More information about AQI is available at the bottom of this webpage.
The grid below shows current AQI air quality conditions for each pollutant that is measured at each of our monitoring stations. By clicking the “Show” button on each monitoring station box, you can see what the AQI conditions were for the past 24 hours, shown in a rolling format.
| Hour | OZONE | PM10 | PM2.5 |
|---|---|---|---|
| 2026-10-30T11:00 | 16 | 12 | 24 |
| 2026-10-30T12:00 | 15 | 13 | 28 |
| 2026-10-30T13:00 | 14 | 13 | 31 |
| 2026-10-30T14:00 | 12 | 18 | 32 |
| 2026-10-30T15:00 | 14 | 19 | 29 |
| 2026-10-30T16:00 | 18 | 24 | 42 |
| 2026-10-30T17:00 | 22 | 20 | 41 |
| 2026-10-30T18:00 | 27 | 20 | 31 |
| 2026-10-30T19:00 | 30 | 20 | 32 |
| 2026-10-30T20:00 | 32 | 22 | 30 |
| 2026-10-30T21:00 | 34 | 20 | 29 |
| 2026-10-30T22:00 | 34 | 12 | 34 |
| 2026-10-30T23:00 | 33 | 13 | 31 |
| 2026-10-31T00:00 | 35 | 14 | 29 |
| 2026-10-31T01:00 | 31 | 13 | 26 |
| 2026-10-31T02:00 | 30 | 17 | 32 |
| 2026-10-31T03:00 | 29 | 17 | 33 |
| 2026-10-31T04:00 | 26 | 19 | 38 |
| 2026-10-31T05:00 | 20 | 19 | 38 |
| 2026-10-31T06:00 | 18 | 17 | 30 |
| 2026-10-31T07:00 | 13 | 15 | 32 |
| 2026-10-31T08:00 | 9 | 12 | 38 |
| 2026-10-31T09:00 | 6 | 12 | 36 |
| 2026-10-31T10:00 | 6 | 11 | 26 |
| 2026-10-31T11:00 | 6 | 10 | 27 |
| 2026-10-31T12:00 | 8 | 9 | 24 |
| 2026-10-31T13:00 | 11 | 10 | 21 |
| 2026-10-31T14:00 | 9 | 9 | 18 |
| 2026-10-31T15:00 | 11 | 9 | 14 |
| 2026-10-31T16:00 | 14 | 9 | 13 |
| 2026-10-31T17:00 | 13 | 14 | 26 |
| 2026-10-31T18:00 | 18 | 11 | 29 |
| 2026-10-31T19:00 | 18 | 11 | 28 |
| 2026-10-31T20:00 | 22 | 14 | 22 |
| 2026-10-31T21:00 | 27 | 12 | 25 |
| 2026-10-31T22:00 | 31 | 9 | 26 |
| 2026-10-31T23:00 | 31 | 10 | 21 |
| 2026-11-01T00:00 | 28 | 13 | 24 |
| 2026-11-01T01:00 | 28 | 13 | 29 |
| 2026-11-01T02:00 | 25 | 13 | 31 |
| 2026-11-01T03:00 | 22 | 11 | 29 |
| 2026-11-01T04:00 | 25 | 9 | 28 |
| 2026-11-01T05:00 | 26 | 8 | 25 |
| 2026-11-01T06:00 | 30 | 6 | 15 |
| 2026-11-01T07:00 | 29 | 6 | 10 |
| 2026-11-01T08:00 | 31 | 6 | 11 |
| 2026-11-01T09:00 | 30 | 6 | 13 |
| 2026-11-01T10:00 | 30 | 4 | 15 |
| 2026-11-01T11:00 | 4 | 15 |
note: values with * indicate last known reading.
Santa Maria
Nov 1, 2026 @ 3:00 am
| Hour | OZONE | PM10 | PM2.5 |
|---|---|---|---|
| 2026-11-01 03:00 am | 30* | 4 | 15 |
| 2026-11-01 02:00 am | 30 | 4 | 15 |
| 2026-11-01 01:00 am | 30 | 6 | 13 |
| 2026-11-01 12:00 am | 31 | 6 | 11 |
| 2026-10-31 11:00 pm | 29 | 6 | 10 |
| 2026-10-31 10:00 pm | 30 | 6 | 15 |
| 2026-10-31 09:00 pm | 26 | 8 | 25 |
| 2026-10-31 08:00 pm | 25 | 9 | 28 |
| 2026-10-31 07:00 pm | 22 | 11 | 29 |
| 2026-10-31 06:00 pm | 25 | 13 | 31 |
| 2026-10-31 05:00 pm | 28 | 13 | 29 |
| 2026-10-31 04:00 pm | 28 | 13 | 24 |
| 2026-10-31 03:00 pm | 31 | 10 | 21 |
| 2026-10-31 02:00 pm | 31 | 9 | 26 |
| 2026-10-31 01:00 pm | 27 | 12 | 25 |
| 2026-10-31 12:00 pm | 22 | 14 | 22 |
| 2026-10-31 11:00 am | 18 | 11 | 28 |
| 2026-10-31 10:00 am | 18 | 11 | 29 |
| 2026-10-31 09:00 am | 13 | 14 | 26 |
| 2026-10-31 08:00 am | 14 | 9 | 13 |
| 2026-10-31 07:00 am | 11 | 9 | 14 |
| 2026-10-31 06:00 am | 9 | 9 | 18 |
| 2026-10-31 05:00 am | 11 | 10 | 21 |
| 2026-10-31 04:00 am | 8 | 9 | 24 |
| 2026-10-31 03:00 am | 6 | 10 | 27 |
| 2026-10-31 02:00 am | 6 | 11 | 26 |
| 2026-10-31 01:00 am | 6 | 12 | 36 |
| 2026-10-31 12:00 am | 9 | 12 | 38 |
| 2026-10-30 11:00 pm | 13 | 15 | 32 |
| 2026-10-30 10:00 pm | 18 | 17 | 30 |
| 2026-10-30 09:00 pm | 20 | 19 | 38 |
| 2026-10-30 08:00 pm | 26 | 19 | 38 |
| 2026-10-30 07:00 pm | 29 | 17 | 33 |
| 2026-10-30 06:00 pm | 30 | 17 | 32 |
| 2026-10-30 05:00 pm | 31 | 13 | 26 |
| 2026-10-30 04:00 pm | 35 | 14 | 29 |
| 2026-10-30 03:00 pm | 33 | 13 | 31 |
| 2026-10-30 02:00 pm | 34 | 12 | 34 |
| 2026-10-30 01:00 pm | 34 | 20 | 29 |
| 2026-10-30 12:00 pm | 32 | 22 | 30 |
| 2026-10-30 11:00 am | 30 | 20 | 32 |
| 2026-10-30 10:00 am | 27 | 20 | 31 |
| 2026-10-30 09:00 am | 22 | 20 | 41 |
| 2026-10-30 08:00 am | 18 | 24 | 42 |
| 2026-10-30 07:00 am | 14 | 19 | 29 |
| 2026-10-30 06:00 am | 12 | 18 | 32 |
| 2026-10-30 05:00 am | 14 | 13 | 31 |
| 2026-10-30 04:00 am | 15 | 13 | 28 |
| 2026-10-30 03:00 am | 16 | 12 | 24 |
Santa Maria
Lompoc
Nov 1, 2026 @ 3:00 am
| Hour | OZONE | PM10 | PM2.5 |
|---|---|---|---|
| 2026-11-01 03:00 am | 24* | 3 | - |
| 2026-11-01 02:00 am | 24 | 3 | 0 |
| 2026-11-01 01:00 am | 24 | 2 | 0 |
| 2026-11-01 12:00 am | 24 | 2 | 0 |
| 2026-10-31 11:00 pm | 23 | 5 | 0 |
| 2026-10-31 10:00 pm | 25 | 6 | Unavailable |
| 2026-10-31 09:00 pm | 24 | 7 | - |
| 2026-10-31 08:00 pm | 24 | 9 | 0 |
| 2026-10-31 07:00 pm | 25 | 8 | 0 |
| 2026-10-31 06:00 pm | 26 | 11 | 0 |
| 2026-10-31 05:00 pm | 27 | 12 | 0 |
| 2026-10-31 04:00 pm | 29 | 10 | 0 |
| 2026-10-31 03:00 pm | 28 | 12 | 0 |
| 2026-10-31 02:00 pm | 27 | 12 | Unavailable |
| 2026-10-31 01:00 pm | 25 | 13 | - |
| 2026-10-31 12:00 pm | 22 | 15 | - |
| 2026-10-31 11:00 am | 19 | 14 | - |
| 2026-10-31 10:00 am | 19 | 10 | - |
| 2026-10-31 09:00 am | 17 | 6 | - |
| 2026-10-31 08:00 am | 15 | 6 | 0 |
| 2026-10-31 07:00 am | 11 | 6 | 0 |
| 2026-10-31 06:00 am | 11 | 6 | 0 |
| 2026-10-31 05:00 am | 7 | 8 | Unavailable |
| 2026-10-31 04:00 am | 4 | 10 | - |
| 2026-10-31 03:00 am | 6 | 12 | 0 |
| 2026-10-31 02:00 am | 10 | 12 | 0 |
| 2026-10-31 01:00 am | 10 | 12 | 0 |
| 2026-10-31 12:00 am | 10 | 10 | 0 |
| 2026-10-30 11:00 pm | 9 | 10 | 0 |
| 2026-10-30 10:00 pm | 9 | 13 | Unavailable |
| 2026-10-30 09:00 pm | 13 | 15 | - |
| 2026-10-30 08:00 pm | 15 | 14 | 0 |
| 2026-10-30 07:00 pm | 19 | 12 | 0 |
| 2026-10-30 06:00 pm | 19 | 14 | 0 |
| 2026-10-30 05:00 pm | 22 | 13 | 0 |
| 2026-10-30 04:00 pm | 27 | 10 | 0 |
| 2026-10-30 03:00 pm | 27 | 9 | 0 |
| 2026-10-30 02:00 pm | 27 | 10 | 0 |
| 2026-10-30 01:00 pm | 27 | 12 | - |
| 2026-10-30 12:00 pm | 27 | 13 | 0 |
| 2026-10-30 11:00 am | 26 | 18 | 0 |
| 2026-10-30 10:00 am | 24 | 18 | 0 |
| 2026-10-30 09:00 am | 17 | 20 | 0 |
| 2026-10-30 08:00 am | 16 | 26 | 0 |
| 2026-10-30 07:00 am | 14 | 29 | 0 |
| 2026-10-30 06:00 am | 12 | 28 | 0 |
| 2026-10-30 05:00 am | 14 | 13 | 0 |
| 2026-10-30 04:00 am | 16 | 8 | 0 |
| 2026-10-30 03:00 am | 14 | 12 | 0 |
Lompoc H Street
Goleta
Nov 1, 2026 @ 3:00 am
| Hour | OZONE | PM2.5 |
|---|---|---|
| 2026-11-01 03:00 am | 23* | 7 |
| 2026-11-01 02:00 am | 23 | 7 |
| 2026-11-01 01:00 am | 23 | 15 |
| 2026-11-01 12:00 am | 25 | 14 |
| 2026-10-31 11:00 pm | 22 | 22 |
| 2026-10-31 10:00 pm | 27 | 28 |
| 2026-10-31 09:00 pm | 28 | 24 |
| 2026-10-31 08:00 pm | 25 | 32 |
| 2026-10-31 07:00 pm | 24 | 31 |
| 2026-10-31 06:00 pm | 23 | 12 |
| 2026-10-31 05:00 pm | 28 | 18 |
| 2026-10-31 04:00 pm | 33 | 19 |
| 2026-10-31 03:00 pm | 36 | 22 |
| 2026-10-31 02:00 pm | 37 | 28 |
| 2026-10-31 01:00 pm | 37 | 29 |
| 2026-10-31 12:00 pm | 37 | 21 |
| 2026-10-31 11:00 am | 37 | 19 |
| 2026-10-31 10:00 am | 35 | 12 |
| 2026-10-31 09:00 am | 29 | 18 |
| 2026-10-31 08:00 am | 26 | 19 |
| 2026-10-31 07:00 am | 21 | 16 |
| 2026-10-31 06:00 am | 21 | 20 |
| 2026-10-31 05:00 am | 20 | 18 |
| 2026-10-31 04:00 am | 18 | 14 |
| 2026-10-31 03:00 am | 14 | 23 |
| 2026-10-31 02:00 am | 17 | 24 |
| 2026-10-31 01:00 am | 17 | 16 |
| 2026-10-31 12:00 am | 15 | 22 |
| 2026-10-30 11:00 pm | 18 | 27 |
| 2026-10-30 10:00 pm | 19 | 37 |
| 2026-10-30 09:00 pm | 19 | 41 |
| 2026-10-30 08:00 pm | 19 | 31 |
| 2026-10-30 07:00 pm | 17 | 29 |
| 2026-10-30 06:00 pm | 25 | 30 |
| 2026-10-30 05:00 pm | 35 | 38 |
| 2026-10-30 04:00 pm | 38 | 38 |
| 2026-10-30 03:00 pm | 39 | 26 |
| 2026-10-30 02:00 pm | 39 | 24 |
| 2026-10-30 01:00 pm | 40 | 21 |
| 2026-10-30 12:00 pm | 38 | 19 |
| 2026-10-30 11:00 am | 34 | 16 |
| 2026-10-30 10:00 am | 32 | 22 |
| 2026-10-30 09:00 am | 30 | 27 |
| 2026-10-30 08:00 am | 18 | 21 |
| 2026-10-30 07:00 am | 12 | 9 |
| 2026-10-30 06:00 am | 13 | 14 |
| 2026-10-30 05:00 am | 17 | 11 |
| 2026-10-30 04:00 am | 17 | 12 |
| 2026-10-30 03:00 am | 20 | 18 |
Goleta
Santa Ynez
Nov 1, 2026 @ 3:00 am
| Hour | OZONE | PM2.5 |
|---|---|---|
| 2026-11-01 03:00 am | 18* | 11 |
| 2026-11-01 02:00 am | 18 | 11 |
| 2026-11-01 01:00 am | 19 | 10 |
| 2026-11-01 12:00 am | 19 | 9 |
| 2026-10-31 11:00 pm | 22 | 13 |
| 2026-10-31 10:00 pm | 21 | 20 |
| 2026-10-31 09:00 pm | 21 | 18 |
| 2026-10-31 08:00 pm | 20 | 15 |
| 2026-10-31 07:00 pm | 22 | 14 |
| 2026-10-31 06:00 pm | 24 | 17 |
| 2026-10-31 05:00 pm | 26 | 17 |
| 2026-10-31 04:00 pm | 26 | 18 |
| 2026-10-31 03:00 pm | 28 | 19 |
| 2026-10-31 02:00 pm | 29 | 17 |
| 2026-10-31 01:00 pm | 28 | 18 |
| 2026-10-31 12:00 pm | 26 | 15 |
| 2026-10-31 11:00 am | 23 | 8 |
| 2026-10-31 10:00 am | 16 | 11 |
| 2026-10-31 09:00 am | 13 | 16 |
| 2026-10-31 08:00 am | 10 | 15 |
| 2026-10-31 07:00 am | 7 | 2 |
| 2026-10-31 06:00 am | 6 | 0 |
| 2026-10-31 05:00 am | 5 | 5 |
| 2026-10-31 04:00 am | 6 | 0 |
| 2026-10-31 03:00 am | 6 | 11 |
| 2026-10-31 02:00 am | 6 | 4 |
| 2026-10-31 01:00 am | 11 | 0 |
| 2026-10-31 12:00 am | 11 | 2 |
| 2026-10-30 11:00 pm | 11 | 9 |
| 2026-10-30 10:00 pm | 14 | 8 |
| 2026-10-30 09:00 pm | 18 | 16 |
| 2026-10-30 08:00 pm | 22 | 27 |
| 2026-10-30 07:00 pm | 24 | 33 |
| 2026-10-30 06:00 pm | 31 | 33 |
| 2026-10-30 05:00 pm | 34 | 32 |
| 2026-10-30 04:00 pm | 35 | 32 |
| 2026-10-30 03:00 pm | 34 | 31 |
| 2026-10-30 02:00 pm | 33 | 28 |
| 2026-10-30 01:00 pm | 33 | 24 |
| 2026-10-30 12:00 pm | 30 | 14 |
| 2026-10-30 11:00 am | 27 | 13 |
| 2026-10-30 10:00 am | 23 | 14 |
| 2026-10-30 09:00 am | 20 | 12 |
| 2026-10-30 08:00 am | 18 | 8 |
| 2026-10-30 07:00 am | 13 | 11 |
| 2026-10-30 06:00 am | 10 | 12 |
| 2026-10-30 05:00 am | 8 | 18 |
| 2026-10-30 04:00 am | 11 | 19 |
| 2026-10-30 03:00 am | 11 | 23 |
Santa Ynez
Las Flores Canyon
Nov 1, 2026 @ 3:00 am
| Hour | OZONE | PM10 |
|---|---|---|
| 2026-11-01 03:00 am | 34* | 6 |
| 2026-11-01 02:00 am | 34 | 6 |
| 2026-11-01 01:00 am | 34 | 6 |
| 2026-11-01 12:00 am | 35 | 5 |
| 2026-10-31 11:00 pm | 33 | 4 |
| 2026-10-31 10:00 pm | 32 | 5 |
| 2026-10-31 09:00 pm | 32 | 6 |
| 2026-10-31 08:00 pm | 35 | 6 |
| 2026-10-31 07:00 pm | 34 | 6 |
| 2026-10-31 06:00 pm | 34 | 6 |
| 2026-10-31 05:00 pm | 32 | 5 |
| 2026-10-31 04:00 pm | 33 | 6 |
| 2026-10-31 03:00 pm | 32 | 5 |
| 2026-10-31 02:00 pm | 33 | 6 |
| 2026-10-31 01:00 pm | 31 | 6 |
| 2026-10-31 12:00 pm | 31 | 6 |
| 2026-10-31 11:00 am | 30 | 6 |
| 2026-10-31 10:00 am | 30 | 7 |
| 2026-10-31 09:00 am | 31 | 5 |
| 2026-10-31 08:00 am | 32 | 4 |
| 2026-10-31 07:00 am | 35 | 6 |
| 2026-10-31 06:00 am | 36 | 8 |
| 2026-10-31 05:00 am | 36 | 8 |
| 2026-10-31 04:00 am | 34 | 6 |
| 2026-10-31 03:00 am | 34 | 6 |
| 2026-10-31 02:00 am | 34 | 6 |
| 2026-10-31 01:00 am | 34 | 6 |
| 2026-10-31 12:00 am | 34 | 7 |
| 2026-10-30 11:00 pm | 33 | 8 |
| 2026-10-30 10:00 pm | 33 | 10 |
| 2026-10-30 09:00 pm | 33 | 10 |
| 2026-10-30 08:00 pm | 33 | 8 |
| 2026-10-30 07:00 pm | 33 | 8 |
| 2026-10-30 06:00 pm | 34 | 9 |
| 2026-10-30 05:00 pm | 34 | 10 |
| 2026-10-30 04:00 pm | 38 | 10 |
| 2026-10-30 03:00 pm | 38 | 10 |
| 2026-10-30 02:00 pm | 38 | 9 |
| 2026-10-30 01:00 pm | 37 | 10 |
| 2026-10-30 12:00 pm | 37 | 8 |
| 2026-10-30 11:00 am | 36 | 8 |
| 2026-10-30 10:00 am | 32 | 7 |
| 2026-10-30 09:00 am | 31 | 7 |
| 2026-10-30 08:00 am | 28 | 5 |
| 2026-10-30 07:00 am | 29 | 4 |
| 2026-10-30 06:00 am | 30 | 4 |
| 2026-10-30 05:00 am | 27 | 4 |
| 2026-10-30 04:00 am | 30 | 5 |
| 2026-10-30 03:00 am | 31 | 6 |
Las Flores Canyon
Carpinteria
Nov 1, 2026 @ 2:00 am
| Hour | OZONE | PM2.5 |
|---|---|---|
| 2026-11-01 02:00 am | 23 | 17* |
| 2026-11-01 01:00 am | 23 | - |
| 2026-11-01 12:00 am | 21 | - |
| 2026-10-31 11:00 pm | 17 | - |
| 2026-10-31 10:00 pm | 14 | - |
| 2026-10-31 09:00 pm | 12 | - |
| 2026-10-31 08:00 pm | 11 | - |
| 2026-10-31 07:00 pm | 14 | 17 |
| 2026-10-31 06:00 pm | 17 | 17 |
| 2026-10-31 05:00 pm | 19 | 28 |
| 2026-10-31 04:00 pm | 25 | 34 |
| 2026-10-31 03:00 pm | 31 | 31 |
| 2026-10-31 02:00 pm | 32 | 34 |
| 2026-10-31 01:00 pm | 34 | 29 |
| 2026-10-31 12:00 pm | 34 | 37 |
| 2026-10-31 11:00 am | 32 | 31 |
| 2026-10-31 10:00 am | 33 | 22 |
| 2026-10-31 09:00 am | 33 | 22 |
| 2026-10-31 08:00 am | 33 | 23 |
| 2026-10-31 07:00 am | 31 | 13 |
| 2026-10-31 06:00 am | 31 | 21 |
| 2026-10-31 05:00 am | 31 | 13 |
| 2026-10-31 04:00 am | 26 | 16 |
| 2026-10-31 03:00 am | 26 | 21 |
| 2026-10-31 02:00 am | 23 | 26 |
| 2026-10-31 01:00 am | 23 | 8 |
| 2026-10-31 12:00 am | 21 | 17 |
| 2026-10-30 11:00 pm | 20 | 22 |
| 2026-10-30 10:00 pm | 19 | 33 |
| 2026-10-30 09:00 pm | 20 | 34 |
| 2026-10-30 08:00 pm | 19 | 40 |
| 2026-10-30 07:00 pm | 25 | 31 |
| 2026-10-30 06:00 pm | 28 | 28 |
| 2026-10-30 05:00 pm | 32 | 29 |
| 2026-10-30 04:00 pm | 31 | 20 |
| 2026-10-30 03:00 pm | 32 | 34 |
| 2026-10-30 02:00 pm | 35 | 30 |
| 2026-10-30 01:00 pm | 39 | 44 |
| 2026-10-30 12:00 pm | 40 | 38 |
| 2026-10-30 11:00 am | 37 | 31 |
| 2026-10-30 10:00 am | 32 | 13 |
| 2026-10-30 09:00 am | 30 | 26 |
| 2026-10-30 08:00 am | 29 | 29 |
| 2026-10-30 07:00 am | 24 | 15 |
| 2026-10-30 06:00 am | 20 | 19 |
| 2026-10-30 05:00 am | 18 | 6 |
| 2026-10-30 04:00 am | 15 | 7 |
| 2026-10-30 03:00 am | 16 | 14 |
Carpinteria
Paradise Road
Nov 1, 2026 @ 2:00 am
| Hour | OZONE |
|---|---|
| 2026-11-01 02:00 am | 24 |
| 2026-11-01 01:00 am | 23 |
| 2026-11-01 12:00 am | 24 |
| 2026-10-31 11:00 pm | 25 |
| 2026-10-31 10:00 pm | 26 |
| 2026-10-31 09:00 pm | 22 |
| 2026-10-31 08:00 pm | 22 |
| 2026-10-31 07:00 pm | 23 |
| 2026-10-31 06:00 pm | 24 |
| 2026-10-31 05:00 pm | 23 |
| 2026-10-31 04:00 pm | 27 |
| 2026-10-31 03:00 pm | 31 |
| 2026-10-31 02:00 pm | 30 |
| 2026-10-31 01:00 pm | 30 |
| 2026-10-31 12:00 pm | 32 |
| 2026-10-31 11:00 am | 30 |
| 2026-10-31 10:00 am | 24 |
| 2026-10-31 09:00 am | 21 |
| 2026-10-31 08:00 am | 21 |
| 2026-10-31 07:00 am | 21 |
| 2026-10-31 06:00 am | 19 |
| 2026-10-31 05:00 am | 15 |
| 2026-10-31 04:00 am | 15 |
| 2026-10-31 03:00 am | 12 |
| 2026-10-31 02:00 am | 12 |
| 2026-10-31 01:00 am | 17 |
| 2026-10-31 12:00 am | 16 |
| 2026-10-30 11:00 pm | 16 |
| 2026-10-30 10:00 pm | 18 |
| 2026-10-30 09:00 pm | 19 |
| 2026-10-30 08:00 pm | 22 |
| 2026-10-30 07:00 pm | 26 |
| 2026-10-30 06:00 pm | 31 |
| 2026-10-30 05:00 pm | 32 |
| 2026-10-30 04:00 pm | 34 |
| 2026-10-30 03:00 pm | 34 |
| 2026-10-30 02:00 pm | 34 |
| 2026-10-30 11:00 am | 19 |
| 2026-10-30 10:00 am | 19 |
| 2026-10-30 09:00 am | 19 |
| 2026-10-30 08:00 am | 11 |
| 2026-10-30 07:00 am | 12 |
| 2026-10-30 06:00 am | 15 |
| 2026-10-30 05:00 am | 12 |
| 2026-10-30 04:00 am | 12 |
| 2026-10-30 03:00 am | 14 |
Paradise Road
Lompoc HS&P
Nov 1, 2026 @ 2:00 am
| Hour | OZONE |
|---|---|
| 2026-11-01 02:00 am | 31 |
| 2026-11-01 01:00 am | 31 |
| 2026-11-01 12:00 am | 31 |
| 2026-10-31 11:00 pm | 31 |
| 2026-10-31 10:00 pm | 30 |
| 2026-10-31 09:00 pm | 31 |
| 2026-10-31 08:00 pm | 32 |
| 2026-10-31 07:00 pm | 33 |
| 2026-10-31 06:00 pm | 36 |
| 2026-10-31 05:00 pm | 36 |
| 2026-10-31 04:00 pm | 36 |
| 2026-10-31 03:00 pm | 36 |
| 2026-10-31 02:00 pm | 37 |
| 2026-10-31 01:00 pm | 35 |
| 2026-10-31 12:00 pm | 33 |
| 2026-10-31 11:00 am | 33 |
| 2026-10-31 10:00 am | 33 |
| 2026-10-31 09:00 am | 32 |
| 2026-10-31 08:00 am | 32 |
| 2026-10-31 07:00 am | 32 |
| 2026-10-31 06:00 am | 31 |
| 2026-10-31 05:00 am | 29 |
| 2026-10-31 04:00 am | 32 |
| 2026-10-31 03:00 am | 32 |
| 2026-10-31 02:00 am | 32 |
| 2026-10-31 01:00 am | 32 |
| 2026-10-31 12:00 am | 32 |
| 2026-10-30 11:00 pm | 35 |
| 2026-10-30 10:00 pm | 35 |
| 2026-10-30 09:00 pm | 34 |
| 2026-10-30 08:00 pm | 31 |
| 2026-10-30 07:00 pm | 33 |
| 2026-10-30 06:00 pm | 34 |
| 2026-10-30 05:00 pm | 35 |
| 2026-10-30 04:00 pm | 35 |
| 2026-10-30 03:00 pm | 36 |
| 2026-10-30 02:00 pm | 39 |
| 2026-10-30 01:00 pm | 39 |
| 2026-10-30 12:00 pm | 36 |
| 2026-10-30 11:00 am | 34 |
| 2026-10-30 10:00 am | 33 |
| 2026-10-30 09:00 am | 31 |
| 2026-10-30 08:00 am | 30 |
| 2026-10-30 07:00 am | 30 |
| 2026-10-30 06:00 am | 30 |
| 2026-10-30 05:00 am | 30 |
| 2026-10-30 04:00 am | 30 |
| 2026-10-30 03:00 am | 28 |
Lompoc HS&P
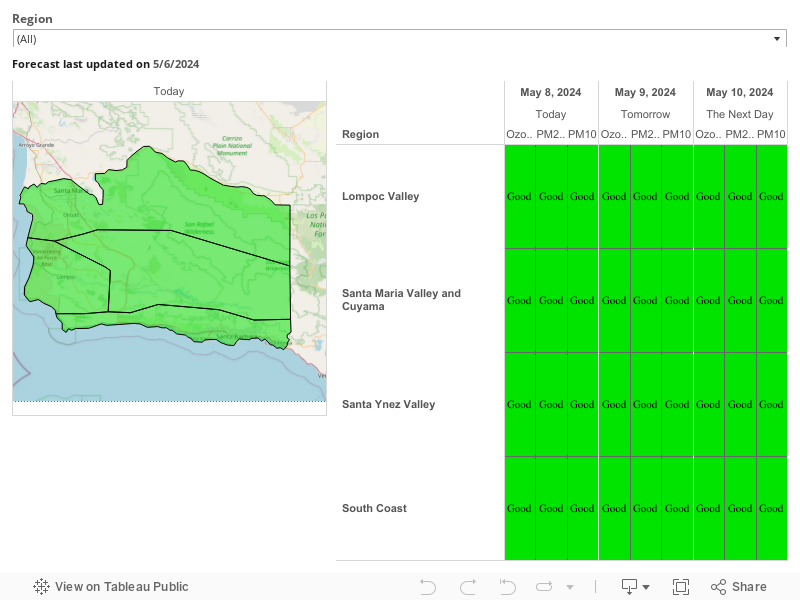
Forecasts
Air quality values and colors shown here correspond with the Air Quality Index (AQI). More information about AQI is available at the bottom of this webpage
Historical Data
To check “AQI Summary by Date”, click the link above which will direct you to EPA’s AirNow website. Select the “Archive” header on the new webpage. Then, use the calendar tool at the bottom of the webpage to select the historical date. On the left side of the screen, there are options to focus on specific pollutants using both the “Contours” and “Monitors” layers.
EPA AirNow Fire and Smoke Map
The EPA has launched a sensor data pilot project on the AirNow Fire and Smoke Map (opens in a new tab) that is designed to provide the public with additional information on levels of fine particle pollution in the air, particularly during wildfires. The Fire and Smoke Map displays air quality data from permanent monitors, temporary monitors, and low-cost sensors. The map uses the EPA’s Air Quality Index (AQI) rating system (see description below).
For additional information on California wildfires, see outlooks and smoke reports posted on the California Smoke Information (opens in a new tab) website.
AQI Values and Recommendations
Refer to the AQI table below to understand how to interpret the AQI colors shown in the table and forecast above. The Index numbers represent a classification of the pollutant, not a direct measurement of the pollutant itself. To view concentration values — which show the actual measured levels of the pollutant — please visit the “Station Data” webpage (currently available only in English). The Index below presents classifications for ozone, particulate matter with a diameter of less than 10 microns (PM10), and particulate matter with a diameter of less than 2.5 microns (PM2.5).
Note: All data are preliminary and subject to verification.
To view instances where standards were exceeded, please refer to “Days Exceeding Particulate and Ozone Standards” (currently available only in English).